
Bitcoin Halving: 2020 BTC Mining Block Reward Chart History

Is the BTC Block Reward Halving Really a Bullish Factor?
The most popular crypto-centric question today is about the details of the infamous bitcoin mining halving.
Every four years, Bitcoin’s block reward (earned by miners who successfully propose new blocks added to the end of the Bitcoin blockchain) is cut in half. First was a cut from 50 BTC to 25 BTC in 2012, and then another to 12.5 BTC in 2016. Now, everybody is anticipating the next halving event, which will drop the block reward to 6.25 BTC in May of 2020. Everyone is keen on sharing just how promising this magical phenomenon will be for the price of bitcoin. But how to be so sure in uncertain times in a naturally volatile emerging asset class. Let's present a tale of two tokens approach towards the bitcoin halving equation.
Bitcoin Mining Halving Sentiment: The Bulls vs Bears
For the rest of 2019 and first half of 2020, bitcoiners anxiously await to see if the consensus comes true.
There is no shortage of #BTC hope and optimism as hopium is littered into all kinds of bold outcomes.
It seems to be commonly accepted in the crypto world that the block reward halving is bullish for Bitcoin’s price. Indeed, when you look at the price charts for the past two $BTC halvings, this obviously appears true.
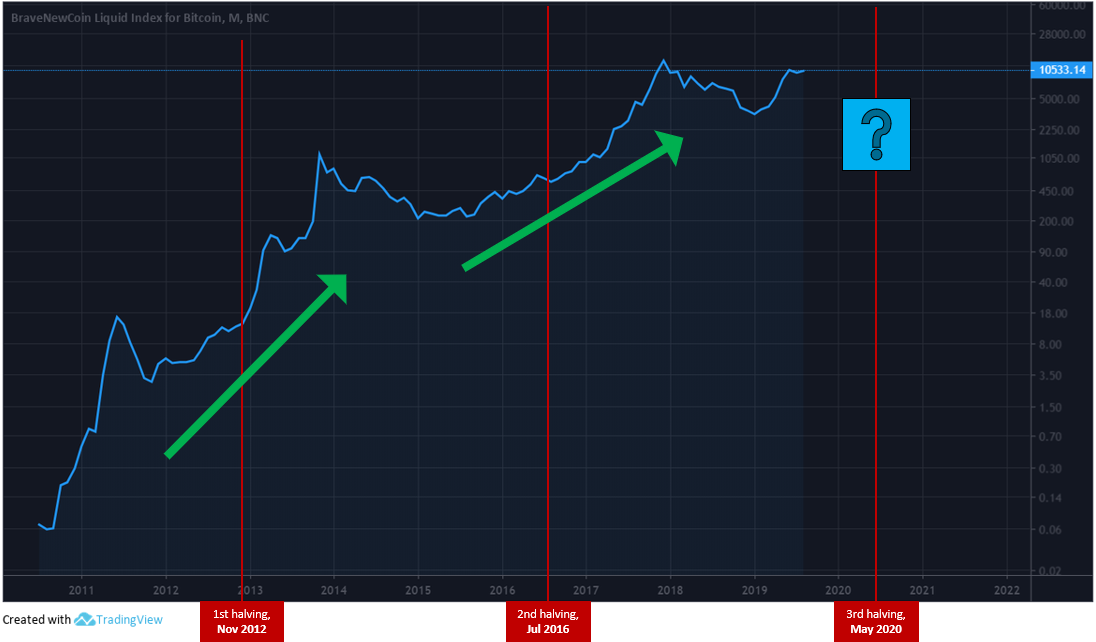
The two previous price peaks have both occurred approximately one year after the halvings, suggesting perhaps the next peak will occur in mid-2021 if the pattern repeats. Will the third time be a crypto charm?
Here are the flagship crypto cliffnotes about the past bitcoin mining block reward halvings:
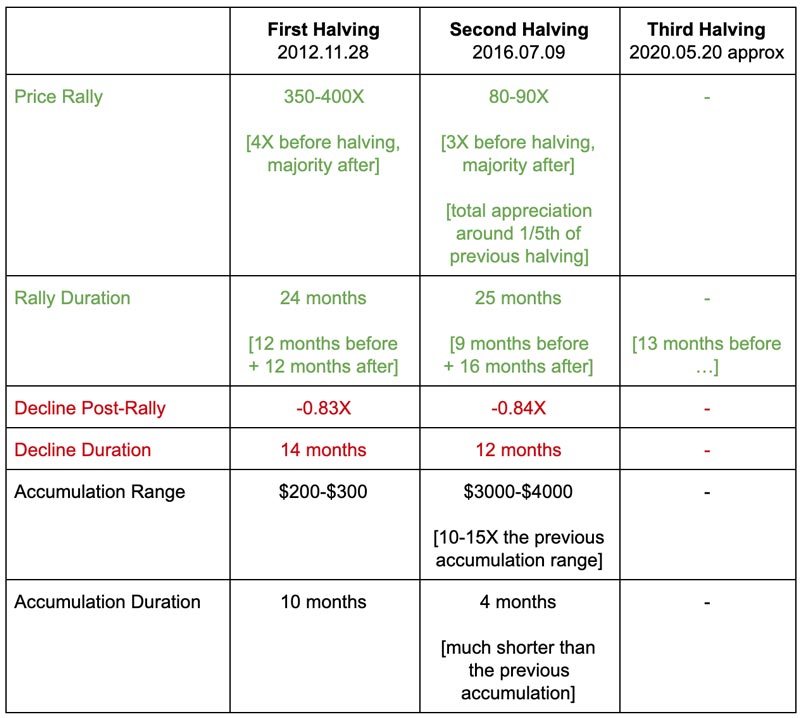
image courtesy of huddl
First Halving: took place on November 28, 2012
Price Ranges: before halving it got boosted four-fold, then increased its value by 350-400X
$BTC Price Status: the first halving response lasted 1 year before and boosted valuations 1 year after
Post Bull Market Cycle: bitcoin declined in value by 83%, then accumulated at $200-$300 for 10 months
The summarizes into bitcoin bull market price action lasted a full 24 months, or two years long.
That is in the same timeframe we are in now gearing up for the third bitcoin mining halving event.
Second Halving: took place on July 9, 2016
Price Ranges: the price of BTC went up three-fold before halving event before going up 90X
$BTC Price Status: accumulation started nearly 9 months before, appreciation in value lasted 16 months
Post Bull Market Cycle: declined the value of bitcoin by 84% before consolidating at $3,000-$3,500 base
The second halving symbolizes the bottom of bitcoin's price to be 10X of the first halving support.
Third Halving: May 20, 2020
Price Ranges: April 1, 2019 bitcoin price went above $4,000 and saw as high as $13,400 in June
Bull Market Status: while the price of bitcoin hovers around the $8,000-$10,000 range, it's wait and see
Post Bull Market Cycle: time will tell all, just grab the #whenlambo memes.gif and have the popcorn ready
However, the real question is whether the price action of the past has been caused by the block reward halvings, or if it was merely a coincidence. Most people in the cryptocurrency industry will suggest that the former is true, but the need for verification needs to be thought out in multiple ways. Nothing is guaranteed.
While the first mining halving cycle was referred to as the retail cycle, followed by a venture cycle, the third phase is dubbed the institutional cycle. That puts only 2.6 million blocks out of 21M total left. #digitalscarcity
But First, A Background Drop on the BTC Halvings
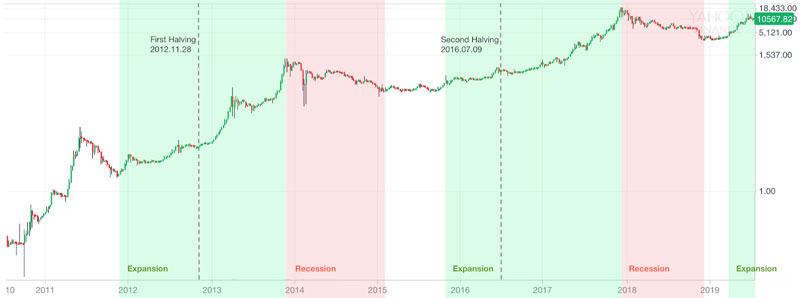
The first two bitcoin halvings saw extremely similar patterns surface as the stages transpired as such:
before: the anticipation of a significant reduction in the new block rewards and liquid supply boosts price
after: FOMO kicks in, higher demand comes in from retail speculators and fresh investors with deep pockets
crash: the bubble burst goes boom, a colossal collapse ensues after reaching all time high in BTC/USD values
the fall: demand goes down the drain, blood in the streets mentality, harsh realities of a crypto winter set in
foundation: a new base finally settles, market equilibrium restores itself and accumulation stage begins
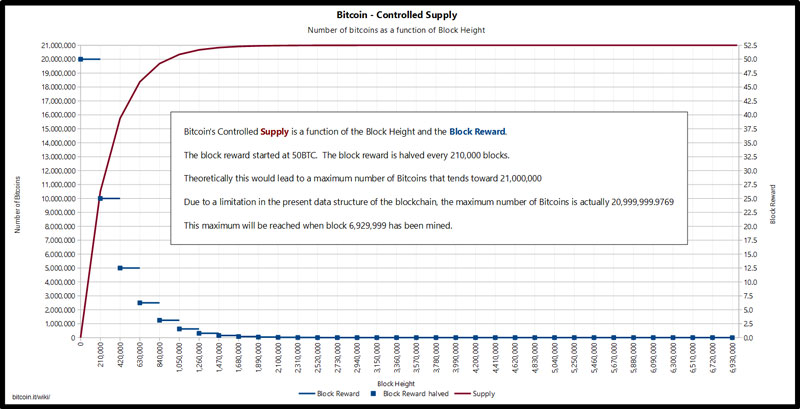
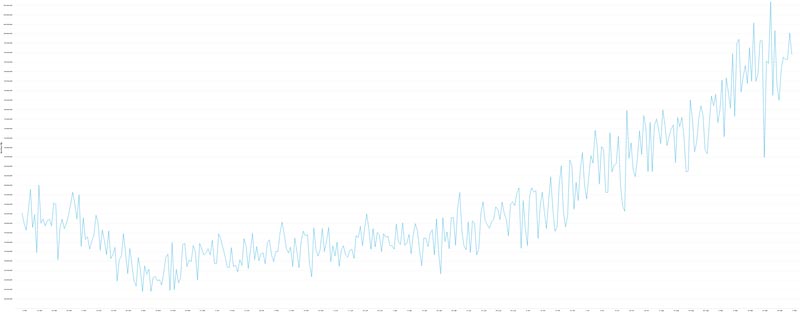
One of the greatest features of Bitcoin is it’s capped supply of 21 million and it’s predictable inflation schedule, which is a native part of the Bitcoin code. In the chart below, you can see the existing supply of bitcoins vs. the rate at which 1,800 new coins are being mined (144 blocks per day x 12.5 BTC).
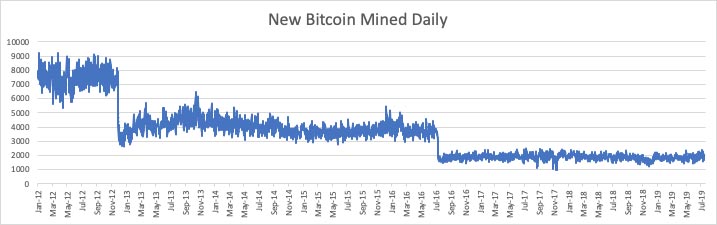
coinmetrics new bitcoin mined daily graphic
At first glance, the block halvings are certainly a disadvantage for those who mine Bitcoins. However, this is a crucial step to reduce currency inflation — bolstering Bitcoin’s main value proposition. And, so long as more people believe in that value proposition, the “real world” value of mining new blocks can keep increasing over time even as the block reward is halved. The next halving cycle will depreciate to 900 new coins daily.
If 1 BTC is worth $100k, a 6.25 BTC block reward would be worth significantly more to miners than a 12.5 BTC block reward when BTC is worth just $10k. On top of that, miners profit from transaction fees, which can become more and more valuable over time as the Bitcoin network continues to grow.
Reviewing the previous halvings
At the time of the first halving in November 2012, the entire Bitcoin economy was too small to be noticed by institutions. In fact, Bitcoin’s price had fallen by over 90% — from $ 31 to $ 2 — about 1 year prior. The price started to rebound in November 2011 and continued to rise through the halving in 2012 until it reached an all-time high of over $1200 in November 2013.
Of course, Bitcoin had another collapse that began at the end of 2013 and lasted until 2015. Then, about 8 months ahead of the next halving that would occur in July 2016, Bitcoin’s price started to recover. During this time, several venture capital companies and hedge funds became involved in the cryptocurrency market along with millions of new retail investors, ultimately pushing Bitcoin to a value of nearly $20k in December 2017. Again, ,ost of the appreciation came after the halving: BTC was worth $650 at the time of the halving, and subsequently increased by more than 30x.
Halvings and bull markets past
The brief review of these two cycles shows an obvious trend in which Bitcoin’s price starts to rise 8-12 months before a halving is anticipated to occur and continues for about 1 year following it. What needs to be investigated is whether the halvings are causing this positive price trend, or if the bull markets and halving events are merely correlated by coincidence.
Factors that affect Bitcoin’s price
Let’s analyze the factors that could provide us with explanations on how the halving leads to an increase in the value of Bitcoin. First of all, we need to analyze the activity of the miners.
blockchain.com graph showing the all time high rate power of the bitcoin blockchain
Bitcoin miners play a key role in the Bitcoin network by confirming transactions. However, miners are also considered marginal suppliers because it’s thought that they typically sell their newly mined bitcoins as soon as possible. All other factors being equal, if miners have fewer bitcoins to sell after a halving, they reduce the total sell volume (i.e. the supply side of the market). As we know, when supply decreases while demand stays constant, price increases.
Another component to consider is that Bitcoin miners have two sources of revenue: the newly minted bitcoins and the transaction fees. When all 21 million bitcoins have been mined, transaction fees will remain the only source of revenue. Even though transaction fees are taken from the existing supply of Bitcoin, for miners they are a source of revenue just like block rewards. In fact, miners are equally likely to sell them to cover their operating expenses. Therefore, the value of transaction fees must also be considered as part of the supply side.
Of course, the other side of the market is demand, which has increased significantly over time as retail, venture, and institutional money have all gotten involved. This growing demand has no doubt had a massive impact on price increases — further muddying the waters as to whether the halvings have been major causes of the past bull markets or if it’s just a coincidence that they occurred during times when demand was taking off.
Popular Theory: “Halving Reduces Liquid Supply Significantly”
The “liquid supply” of a currency is the portion of the total supply which is actively circulating. In other words, HODLing your Bitcoin for months or years on end removes them from the liquid supply, because they aren’t being traded or exchanged.
It’s believed that miners aren’t typically HODLers because they have to sell into fiat currencies to pay operational expenses. This means that newly mined BTC are part of the liquid supply.
In the first ~4 years of Bitcoin’s existence, 7500-8000 BTC were mined every day and added to the circulating supply. After the first halving, this amount fell to 3700-4000. Currently, 1900–2000 Bitcoins are added to the supply every single day, which will drop below 1000 Bitcoins a day after the next halving.
In terms of US dollars, what emerges is a somewhat different view. As we mentioned, Bitcoin’s price was $13 on the day of the first halving. So when the daily amount mined was cut by about 4000 BTC (from 8000 to 4000), this amounted to a ~$52k reduction in value of Bitcoins joining the liquid supply each day. For the second halving when BTC was $650, this amounted to approximately $1.3M reduction.
But what does that mean?
Well, think about it this way: a reduction of any sizeable amount in liquid supply means that even if demand stagnated and remained flat, the price would increase as a result of the halving. This, ultimately, is why many people think that halvings are bullish.
Contradicting Theory: Efficient Market Hypothesis
There is one HUGE point that the halving bulls tend to ignore or explain away: the efficient market hypothesis (EMH). This essentially states that in a rational market, assets always trade at their fair value on exchanges.
Of course, no market is perfectly rational. The question is: how rational is the Bitcoin market?
Bitcoin’s inflation schedule is known years in advance. That means that the reduction in liquid supply that results from a halving is known to every informed participant in the market years in advance.
If this is public knowledge, the EMH states that the effects of the halving should be priced in by the market before the halving actually occurs. In other words, it can explain some of the bullish price action that seems to occur in the months leading up to a halving, but the bullish price action afterwards wouldn’t be a result of the reduction in liquid supply if the EMH holds true.
With venture and institutional funds now holding heavy bags of Bitcoin, it seems likely that the market is far more rational today than ever before. So with that being said, how likely is it that the next halving will actually trigger another huge bull run?
If the Bitcoin market isn’t efficient, why didn’t hashrate drop after past halvings?
One final point to consider is the important metric of network hashrate. That is, the total computing power of all the miners in the Bitcoin network at the time of the halving.
If miners have to sell most or all of their coins immediately after receiving them to pay for their operational costs, you would expect the halvings to make mining unprofitable for many miners.
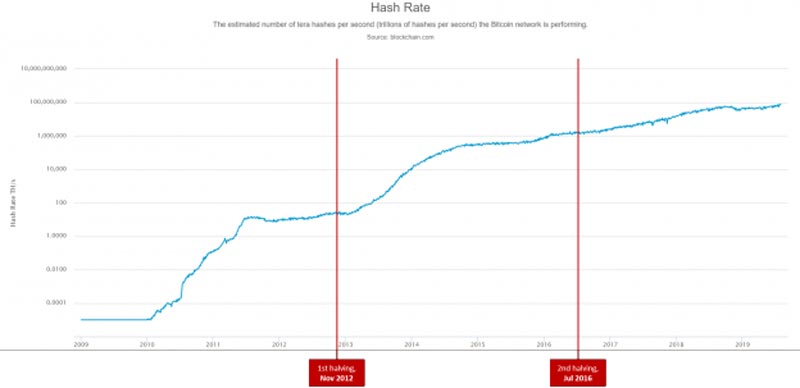
However, based on the historical hash rate, halvings have not caused any noteworthy drops in total hashing power. This indicates that perhaps the EMH is valid, and miners are rational enough to include halvings when they calculate future costs and revenue.
Conclusion: Causation or Coincidence?
Reflecting on the two contradictory theories above, one thing we can say is that the next halving is not guaranteed to cause another bull run to a new all-time high. It could just as easily be the case that the next halving makes mining unprofitable for a large portion of the current miners, leading to a shard drop in hashrate and decrease in public sentiment about the stability of the Bitcoin network.
We’ll leave you with one last thought…
Maybe Bitcoin’s market is efficient, and halvings do get priced in ahead of time. That would explain why price action has turned positive many months before each of the past halvings. At the same time, isn’t it possible that the months of positive price action leading up to the halvings garner significant attention from new investors, driving up demand and fueling the latter portion of the bull markets following the halvings?
It’s hard to say for sure now, but maybe we’ll have our answer after another halving or two.
The post Bitcoin Halving: 2020 BTC Mining Block Reward Chart History appeared first on Master The Crypto.
OhNoCrypto
via https://www.ohnocrypto.com
Aziz, Master the Crypto Founder, Khareem Sudlow