
Bitcoin Closes on $11k as Two Technical Indicators Conflict
Bitcoin has been in a steady uptrend since the weekend. The short term picture looks promising but a conflicting technical signal indicator on a longer term chart could spell the end of the upturn.
Bitcoin Almost at $11,000
A few hours ago during Asian trading, BTC posted a weekly high of $10,950 according to Tradingview.com. The price is back at last Tuesday’s resistance turned support level and up almost 10 percent since the weekend dip. In the hours that followed there was a slight pullback to around $10,800 where Bitcoin is currently trading.
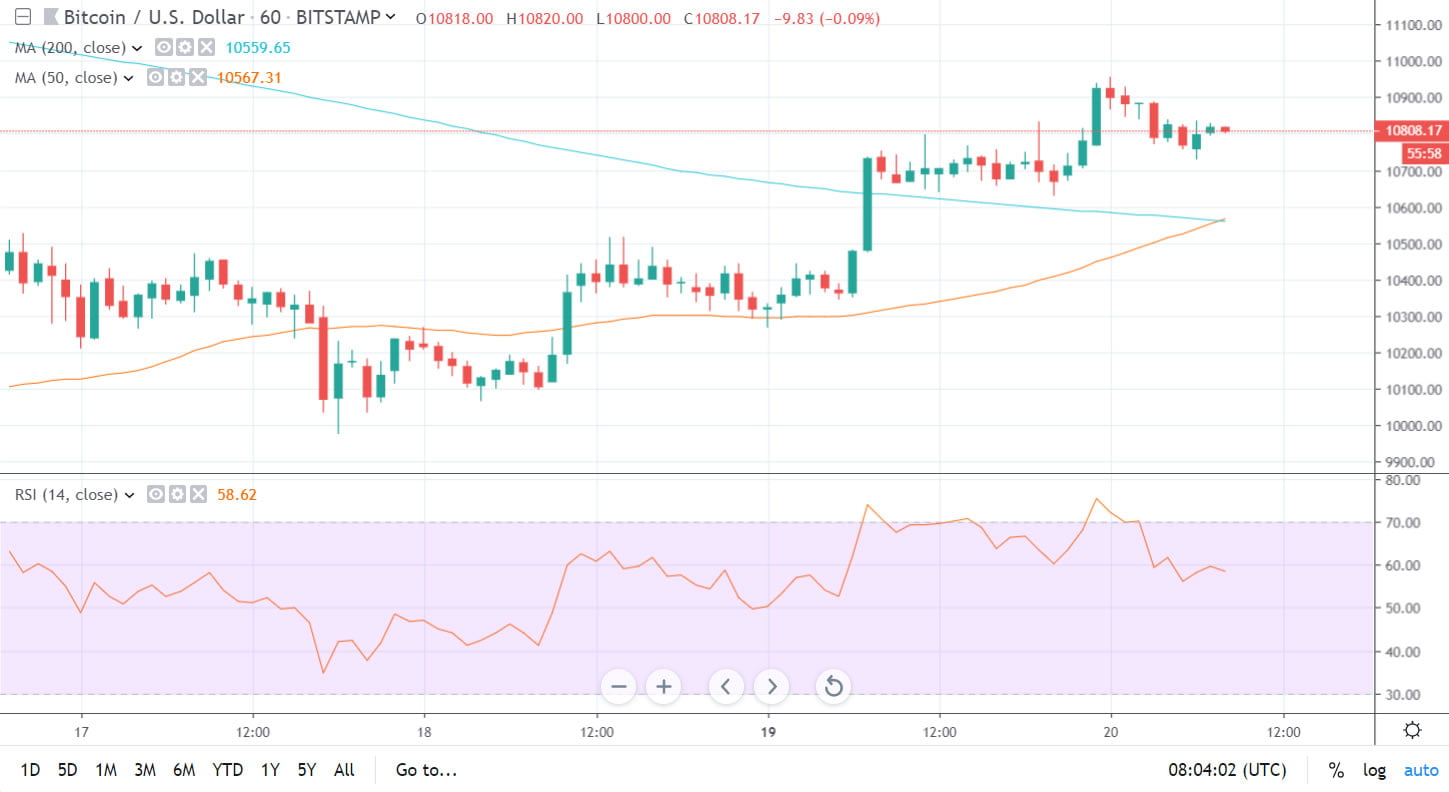
BTC price 1 hour chart – Tradingview.com
The one hour chart revealed a ‘golden cross’ has just formed with the short term 50 hour moving average crossing the longer term 200 hour MA. This is a bullish trend reversal signal for this time frame and has come nine days after the opposing signal on the down trend. The next level of resistance for BTC from here is $11,400, should the trend continue upwards.
Four Hour Death Cross
The longer term four hour chart shows the complete opposite however with the 50 moving average about to cross below the 200 in a ‘death cross’. This usually indicates the continuation of a down trend on this time frame.
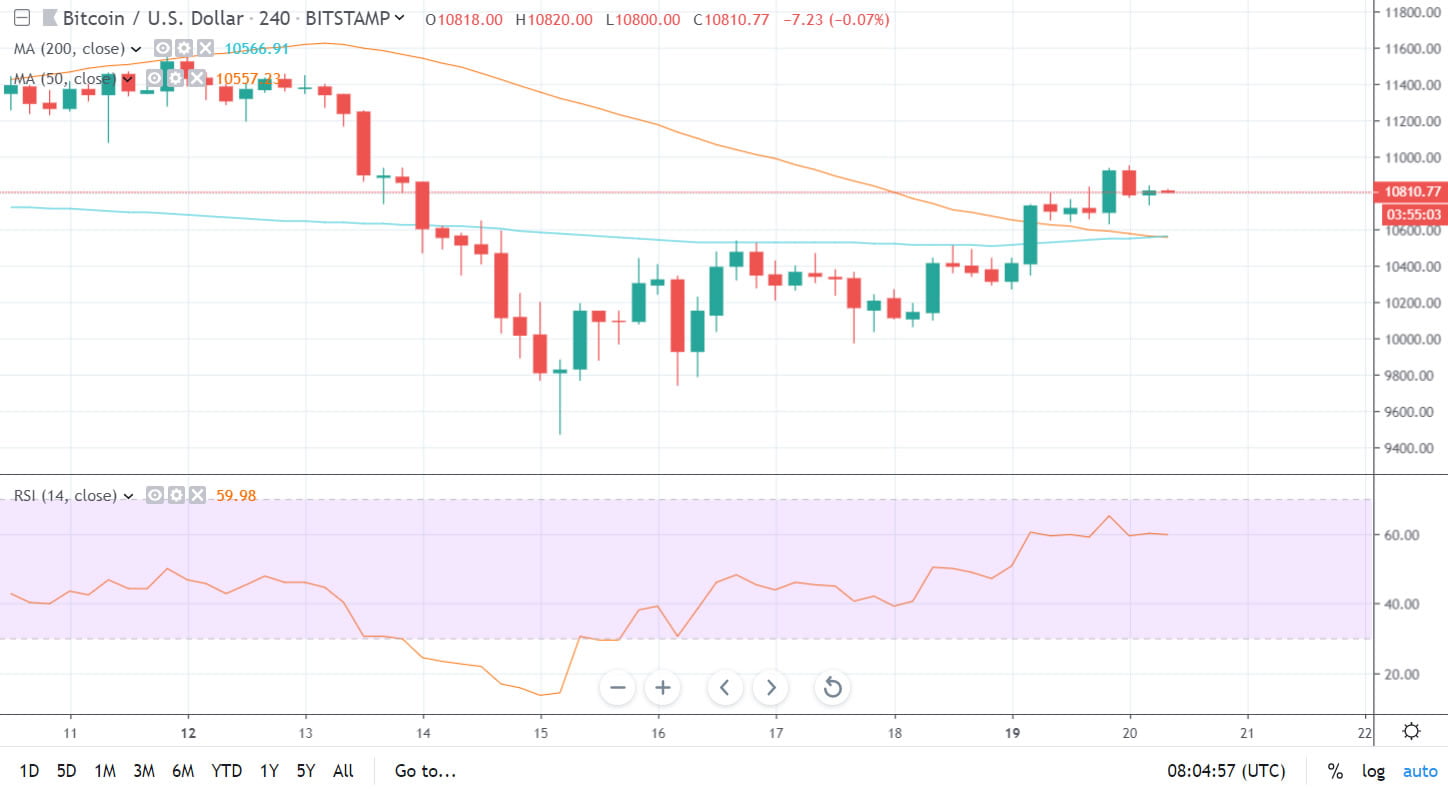
BTC price 4 hour chart – Tradingview.com
It should be noted though that these are lagging indicators which derive their positions from previous prices, not future ones. So a cross on the four hour chart does not necessarily mean that BTC is about to dump back to $9,000!
Zooming out to that day chart is still bullish as the uptrend is intact and the six weeks of consolidation at this price range has continued. The market is very choppy at the moment and these price swings are offering no indication of when a sustained movement in either direction will occur. The conflicting crosses just exemplify the current status of the market.
Price does not move in a straight line, as noted by crypto trader ‘BenjaminBlunts’, so patience is the key for those seeking longer term gains.
“pretty much where i feel we are in the $btc cycle, nothing moves in straight lines … you want them sick gains? then be patient, because patience is a virtue.”
pretty much where i feel we are in the $btc cycle, nothing moves in straight lines.
you want them sick gains? then be patient, because patience is a virtue. pic.twitter.com/048k2nenHR
—
BenjaminBlunts
(@SmartContracter) August 20, 2019
There are a lot of fractals in the historical Bitcoin price charts and these repeating patterns are likely to continue as the asset marches upwards. Buying the dip has been advised frequently and those that have done exactly that since the beginning of the year will be sitting pretty right now.
Image from Shutterstock
The post Bitcoin Closes on $11k as Two Technical Indicators Conflict appeared first on NewsBTC.
OhNoCrypto
via https://www.ohnocrypto.com
Martin Young, Khareem Sudlow