
Ripple Price (XRP) Is Facing Key Resistance While Bitcoin Is Correcting
#crypto #bitcoin
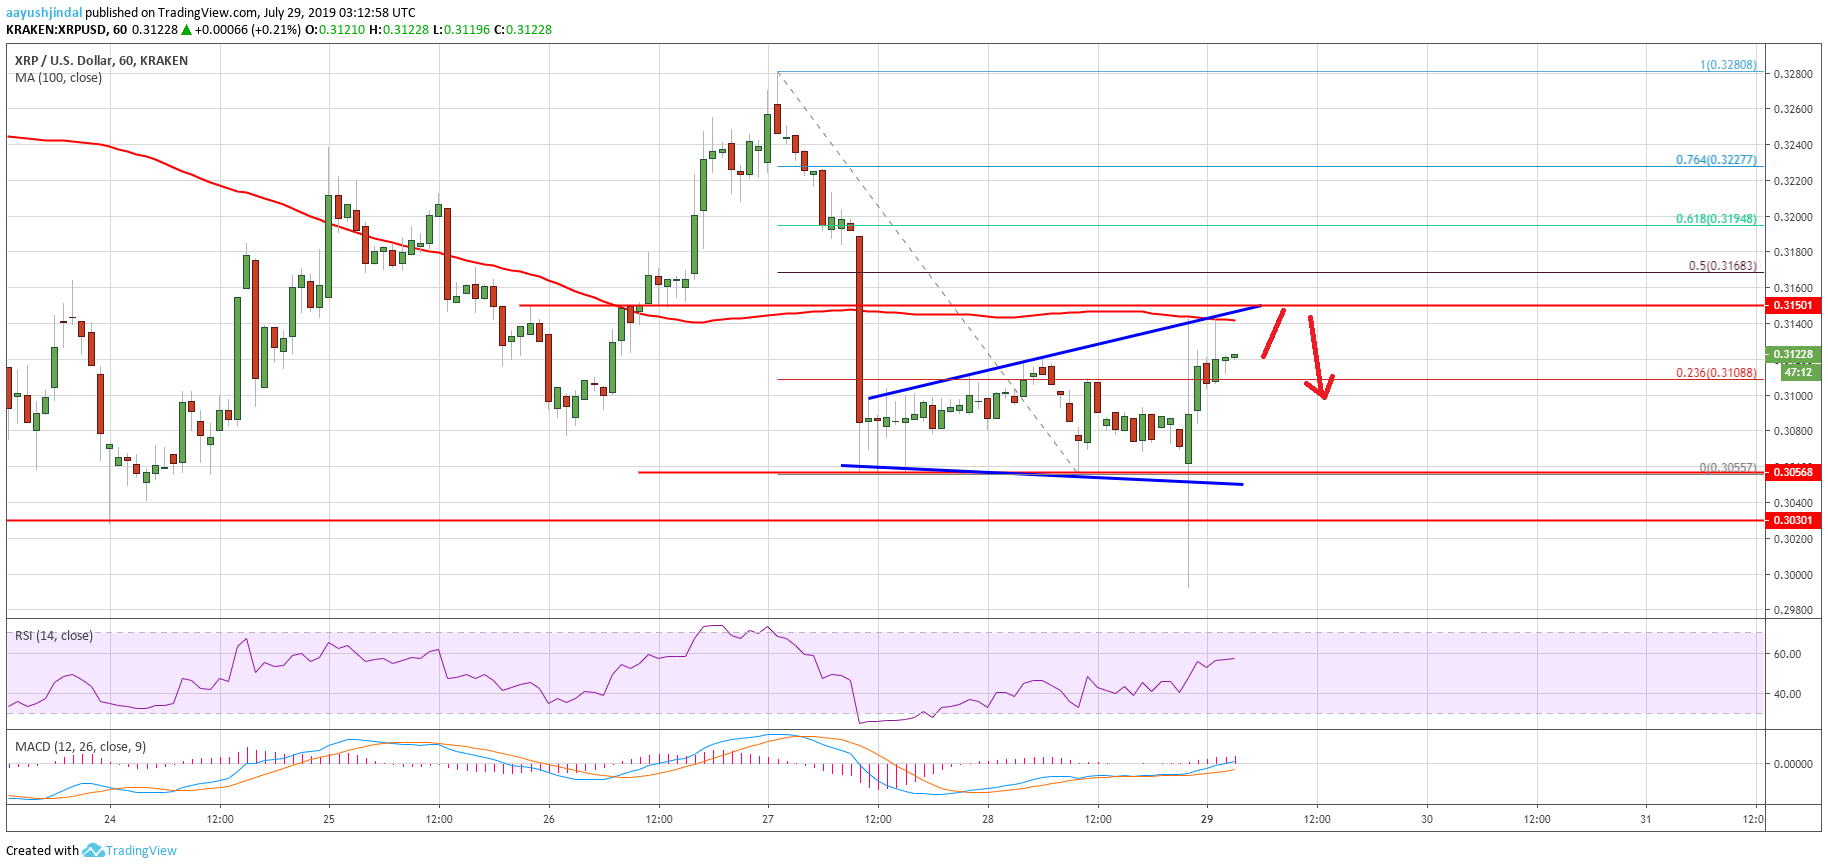
There was a break above the 23.6% Fib retracement level of the downward move from the $0.3280 high to $0.3055 swing low. Besides, the bulls managed to push the price above the $0.3100, but the $0.3140 level acted as a major hurdle. More importantly, there is an expanding triangle forming with resistance near $0.3145 on the hourly chart of the XRP/USD pair.
Clearly, the pair failed to surpass the $0.3150 pivot level and the 100 hourly simple moving average. It also stayed well below the 50% Fib retracement level of the downward move from the $0.3280 high to $0.3055 swing low. It seems like the price is facing a strong resistance near the $0.3150 and $0.3160 levels. To start a strong recovery, the price must break $0.3160 and settle nicely above the 100 hourly SMA.
On the downside, an immediate support is near the $0.3080 level. However, the main supports are near the $0.3050 and $0.3030 levels. If there is a downside break below the $0.3030 support, there could be more losses below the $0.3000 and $0.2980 support levels.
Looking at the chart, ripple price is showing a few bearish signs below $0.3150 while bitcoin managed to move back above $9,500. However, the overall price action suggests range moves above the $0.3030 support level. On the upside, a break above $0.3160 might call for more upsides towards the $0.3280 level.
Hourly RSI (Relative Strength Index) – The RSI for XRP/USD is currently above the 50 level.
Major Support Levels – $0.3080, $0.3050 and $0.3030.
Major Resistance Levels – $0.3140, $0.3150 and $0.3160.
The post Ripple Price (XRP) Is Facing Key Resistance While Bitcoin Is Correcting appeared first on NewsBTC.
OhNoCrypto
via https://www.ohnocrypto.com
Aayush Jindal, Khareem Sudlow
- Ripple price retested the $0.3030 support level and recently corrected higher against the US dollar.
- The price seems to be trading in a range with a strong resistance near the $0.3140 level.
- There is an expanding triangle forming with resistance near $0.3145 on the hourly chart of the XRP/USD pair (data source from Kraken).
- The price could decline again if it continues to struggle near the $0.3140 and $0.3150 resistance levels.
Ripple Price Analysis
Recently, there was a sharp decline in ripple price from the $0.3280 resistance against the US Dollar. The XRP/USD pair broke many important supports near $0.3200 and $0.3140 to enter a bearish zone. Moreover, the price spiked below the $0.3050 support and the 100 hourly simple moving average. However, the $0.3030 support level acted as a decent support and the price bounced back above $0.3050.There was a break above the 23.6% Fib retracement level of the downward move from the $0.3280 high to $0.3055 swing low. Besides, the bulls managed to push the price above the $0.3100, but the $0.3140 level acted as a major hurdle. More importantly, there is an expanding triangle forming with resistance near $0.3145 on the hourly chart of the XRP/USD pair.
Clearly, the pair failed to surpass the $0.3150 pivot level and the 100 hourly simple moving average. It also stayed well below the 50% Fib retracement level of the downward move from the $0.3280 high to $0.3055 swing low. It seems like the price is facing a strong resistance near the $0.3150 and $0.3160 levels. To start a strong recovery, the price must break $0.3160 and settle nicely above the 100 hourly SMA.
On the downside, an immediate support is near the $0.3080 level. However, the main supports are near the $0.3050 and $0.3030 levels. If there is a downside break below the $0.3030 support, there could be more losses below the $0.3000 and $0.2980 support levels.
Looking at the chart, ripple price is showing a few bearish signs below $0.3150 while bitcoin managed to move back above $9,500. However, the overall price action suggests range moves above the $0.3030 support level. On the upside, a break above $0.3160 might call for more upsides towards the $0.3280 level.
Technical Indicators
Hourly MACD – The MACD for XRP/USD is currently losing momentum in the bullish zone.Hourly RSI (Relative Strength Index) – The RSI for XRP/USD is currently above the 50 level.
Major Support Levels – $0.3080, $0.3050 and $0.3030.
Major Resistance Levels – $0.3140, $0.3150 and $0.3160.
The post Ripple Price (XRP) Is Facing Key Resistance While Bitcoin Is Correcting appeared first on NewsBTC.
OhNoCrypto
via https://www.ohnocrypto.com
Aayush Jindal, Khareem Sudlow