
Bitcoin Price Analysis: Bears and Bulls Fight In Consolidation Range

Over the last 4 days, Bitcoin price has been consolidating within a $1,000 range clearly forming an asymmetrical triangle. Price action is squeezing, resulting in the range becoming tighter as market price nears the end of the triangle. A clear breakout or breakdown will present a great trade opportunity in the coming days.
Bitcoin Price 4 Hour Analysis
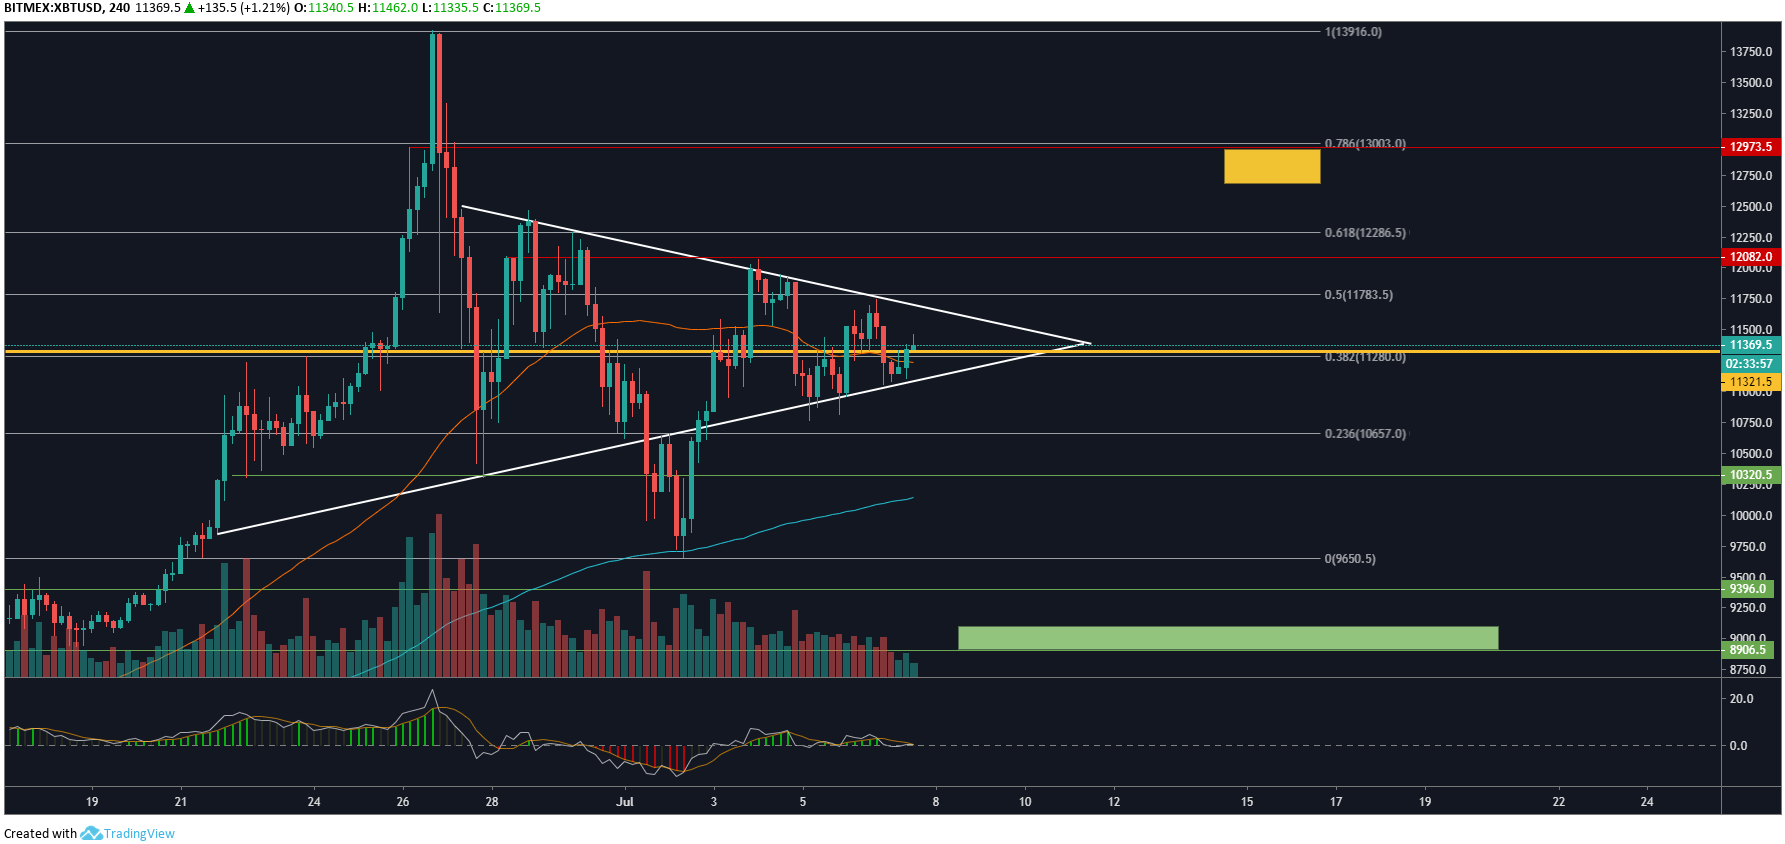
On the 4 Hour chart, we can see an asymmetrical triangle has formed as a result of the most recent pull-back to $9,600 from the yearly high around $13,900. Price action range is becoming increasingly narrower as price levels near towards the end of the triangle. This is a strong sign of ”suppression” as trading range begins to tighten, after a large move an explosive move must happen thereafter. The same concept can be applied to a spring, in the same way when a spring or coil is suppressed it will eventually spring back open. This concept is commonly seen with the indicator ”Bollinger Bands”.
The best way to approach trading Bitcoin over the coming days is to assume a break to the upside or downside of the highlighted triangle will result in further movement in that direction, this presents a great risk/reward breakout trade opportunity. Key levels to look out for if price levels break to the downside are $9,700, $9,300, $8,900 and $8,300.
Current market price sits directly on the 50MA for the 4 Hour timeframe, this is commonly seen on the weekends as volume drops and market price returns to a common median, which in this case is the 50MA at $11,300 which also so happens to be the 4 Hour POC (Point of Control). This again backs up my thesis of an explosive move coming over the coming days as price levels appear to be suppressed.
Bitcoin Price 30 Minute Analysis
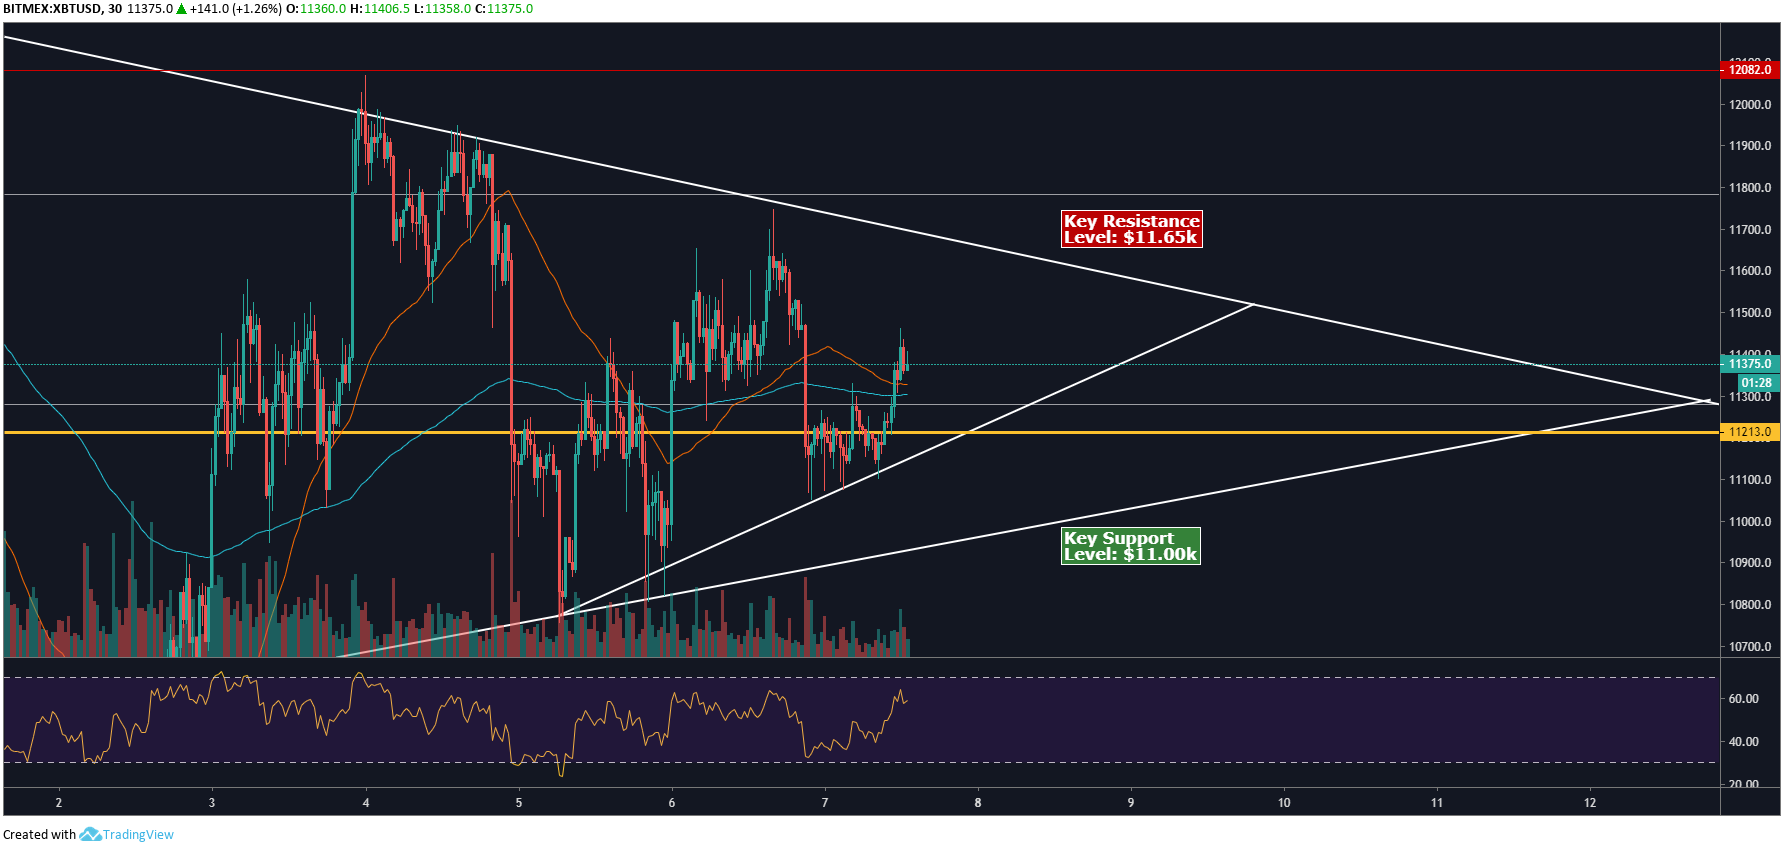
On the 30 Minute, we can see how price action is unfolding within the asymmetrical triangle. There’s been numerous tests of both overhead resistance and ascending support over the last 7 Days, really beginning to show the strength of this trading pattern. Over the last 48 Hours, we can see another small uptrend has formed within the triangle, I will be using this uptrend to gauge whether price action will likely re-test support around $11,000 first or resistance around $11,650. Whichever way price action decides to break I will be entering into the corresponding position (short/long).
It’s likely we will see the triangle continue to play out well into this coming week, resulting in price action range becoming tighter and tighter. Many traders will get caught up within the trading range hoping for a trade opportunity whilst completely missing the clear asymmetrical triangle on the hourly timeframes. We will know by July 12th where BTC plans to head and how best to approach your entries/exits. You can check out my previous analysis on BTC from just a few days ago to see how price action has developed this week.
Do you think BTC price will break up or down in the coming days? Please leave your thoughts in the comments below!
Images via Shutterstock, Tradingview
The post Bitcoin Price Analysis: Bears and Bulls Fight In Consolidation Range appeared first on Bitcoinist.com.
OhNoCrypto
via https://www.ohnocrypto.com
Smith, Khareem Sudlow